UK areas with highest house price rises since Location, Location, Location began

The areas of the UK where house prices have shot up the most since the first episode of Location, Location, Location aired have been revealed.
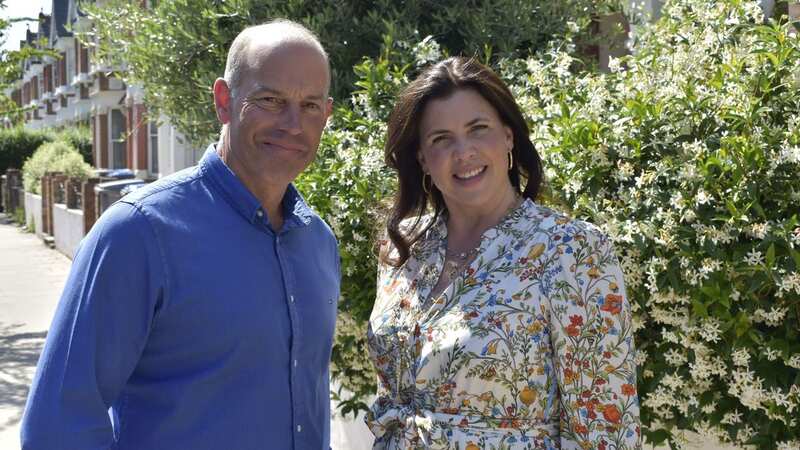
The show, in which hosts Kirsty Allsopp and Phil Spencer try to find the dream home for a couple each week, first appeared on our television screens in May 2000.
Tonight marks the beginning of its 40th episode and since then, scores of people have appeared with the property experts in towns and cities across the UK.
In the 23 years since the first episode aired, house prices have increased throughout the country. Back then, the average house cost £78,810 in England and Wales, according to data from the Land Registry.
It has now increased to £299,715 according to the latest figures, a jump of 286%. Manchester has seen the biggest boom in house prices of anywhere in England and Wales since the show’s first episode. The average house in the city cost £41,625 back in May 2000 and is now at £241,956, according to the latest data. That’s a rise of 481%, almost six times higher than when Location, Location, Location first aired.
 UK house prices fall again - down 3.2% from last year peak, says Nationwide
The City of London has seen the next largest percentage increase in house prices, with homes costing 408% more than they did 23 years ago. Hackey is next at 394%, followed by Waltham Forest at 390%, Leicester at 384%, Thanet at 373%, and Isle of Anglesey at 386%. Meanwhile, the average price in Newcastle upon Tyne has gone from £58,763 to £204,356, an increase of 248%, while in Northumberland prices have increased from £58,414 to £202,417, or 247%.
Top 20 percentage rises
Manchester: £41,625 to £241,956 (481%)
City of London: £175,041 to £889,432 (408%)
Hackney: £127,912 to £632,099 (394%)
Waltham Forest: £102,387 to £501,675 (390%)
Leicester: £46,900 to £227,176 (384%)
Thanet: £64,256 to £304,161 (373%)
Isle of Anglesey: £50,615 to £236,923 (368%)
Vale of Glamorgan: £70,628 to £330,392 (368%)
 New mum who thought she had 'baby brain' died from cancer months later
Thurrock: £72,016 to £335,122 (365%)
Oldham: £42,047 to £195,582 (365%)
Barking and Dagenham: £75,126 to £349,371 (365%)
Bury: £52,377 to £242,116 (362%)
Bolsover: £39,043 to £178,996 (358%)
Folkestone and Hythe: £74,626 to £341,649 (358%)
Trafford: £81,539 to £371,881 (356%)
Salford: £46,824 to £211,868 (352%)
North Northamptonshire: £59,640 to £269,635 (352%)
Ceredigion: £56,925 to £257,350 (352%)
City of Bristol: £78,052 to £352,156 (351%)
South Hams: £98,367 to £442,985 (350%)
London
City of London: £175,041 to £889,432 (408%)
Hackney: £127,912 to £632,099 (394%)
Waltham Forest: £102,387 to £501,675 (390%)
Barking and Dagenham: £75,126 to £349,371 (365%)
Lewisham: £103,960 to £466,920 (349%)
Newham: £90,941 to £406,109 (347%)
Haringey: £143,566 to £629,507 (338%)
Southwark: £133,380 to £550,323 (313%)
Greenwich: £107,371 to £440,716 (310%)
Brent: £140,113 to £562,572 (302%)
Redbridge: £122,803 to £488,105 (297%)
Merton: £151,026 to £592,471 (292%)
Havering: £108,520 to £423,796 (291%)
Bexley: £101,274 to £393,738 (289%)
Lambeth: £145,228 to £556,966 (284%)
Enfield: £120,935 to £443,892 (267%)
Islington: £191,388 to £700,036 (266%)
Westminster: £260,800 to £950,206 (264%)
Barnet: £165,737 to £598,661 (261%)
Hillingdon: £129,652 to £461,581 (256%)
Kensington and Chelsea: £382,489 to £1,358,879 (255%)
Ealing: £153,334 to £542,386 (254%)
Croydon: £117,832 to £416,795 (254%)
Camden: £248,815 to £869,066 (249%)
Hounslow: £133,955 to £466,627 (248%)
Bromley: £147,556 to £511,635 (247%)
Sutton: £123,844 to £427,744 (245%)
Richmond upon Thames: £225,531 to £776,521 (244%)
Wandsworth: £184,200 to £627,901 (241%)
Kingston upon Thames: £161,339 to £548,778 (240%)
Harrow: £150,698 to £511,271 (239%)
Tower Hamlets: £142,126 to £464,536 (227%)
Hammersmith and Fulham: £246,593 to £779,274 (216%)
Greater Manchester rise
Manchester: 481%
Oldham: 365%
Bury: 362%
Trafford: 356%
Salford: 352%
Tameside: 349%
Bolton: 334%
Wigan: 313%
Rochdale: 312%
Stockport: 306%
Cambridgeshire
Peterborough: £57,814 to £246,604 (327%)
Fenland: £58,144 to £239,849 (313%)
Huntingdonshire: £79,929 to £320,903 (301%)
Cambridgeshire: £90,473 to £360,170 (298%)
East Cambridgeshire: £90,242 to £358,486 (297%)
Cambridge: £132,285 to £513,078 (288%)
South Cambridgeshire: £125,637 to £453,195 (261%)
North East (excl Teesside)
North Tyneside: £50,098 to £216,905 (333%)
Gateshead: £44,599 to £156,310 (250%)
Newcastle upon Tyne: £58,763 to £204,356 (248%)
Northumberland: £58,414 to £202,417 (247%)
South Tyneside: £49,045 to £166,814 (240%)
Darlington: £50,287 to £161,066 (220%)
Hartlepool: £45,436 to £142,794 (214%)
Sunderland: £47,021 to £145,082 (209%)
County Durham: £44,853 to £129,753 (189%)
Read more similar news:
Comments:
comments powered by Disqus


