UK house prices mapped - check if your area is falling or rising in price
House prices fell again by an average of £1,497 across the UK in September, the latest figures show.
It means the average home cost £291,385 in the UK in the 12 months to September, according to the latest house price index data from the Land Registry.
This is down by 0.5% compared to August, and down by 0.1% compared to September 2022.
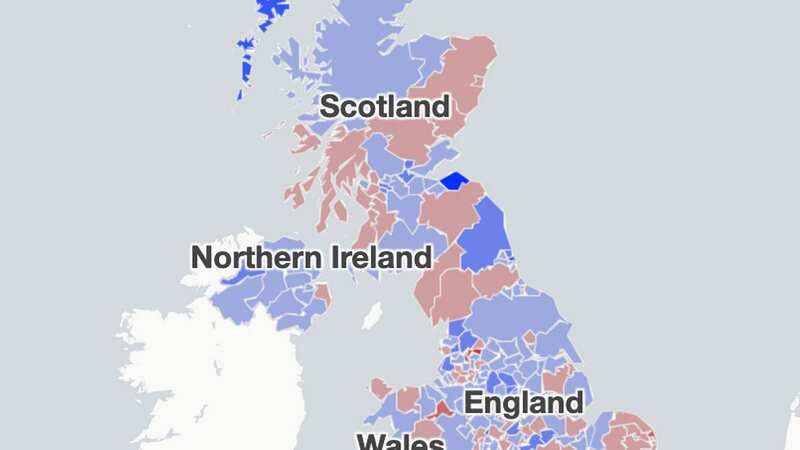
However, not everywhere saw prices decrease - and some areas appearing to be completely bucking the trend. Our interactive map shows the change in house prices in your area:
East Lothian has seen the largest annual increase of any local authority in the country, with prices in the costal region east of Edinburgh rising by 15.2% according to the Land Registry data. Homes there cost an average of £347,866 in the 12 months to September. South Tyneside had the next largest annual increase, where the average home now costs £170,306. This is 9.8% more than a year earlier.
 UK house prices fall again - down 3.2% from last year peak, says Nationwide
Homes in Na h-Eileanan Siar, located in the Outer Hebrides, cost an average of £176,495 each in the year to September, representing a 9.4% rise. Test Valley in Hampshire has the next largest annual increase at 8.6%, taking the average price up to £440,304. This was followed by Cannock Chase at 8.1% (average of £24,2747), North East Derbyshire at 7.4% (£257,054), Ribble Valley 7.3% (£284,352), Harborough 7.1% (£381,947), Clackmannanshire 6.9% (£177,410), and West Lancashire 6.9% (£245,053).
Prices in Kensington and Chelsea are meanwhile falling faster than anywhere else in the country - but they'll still cost you a pretty penny. The average home there cost £1,203,055 in the year to September, according to the latest data. This represents a 20.6% decrease compared to last year, the largest percentage drop of any local authority in the UK.
Prices also fell by in The City of London 15.7% compared to a year earlier, the second largest drop in the country. This is followed by Blaenau Gwent where prices have dropped 11.2% in the last year, Burnley at 10.9% and Hastings at 9.7%.
Read more similar news:
Comments:
comments powered by Disqus